Microsoft Excel is one of the most popular software, used in many different industries. It is so popular, that it is used by 1 in every 8 people on Earth (I don’t know the numbers from other planets though), but this big number marks the popularity of the software, and the thing is that it is used in multiple industries, for very basic (accounting, data entry, etc) to very complex functions (data analysis, data visualization, etc).
Along with that, there is another term that is trending continuously – “Artificial Intelligence”. Though this is not a new term, it has been gaining enormous popularity. There are some AI tools, that have taken the use of AI to a whole other level.
The point is that there are many AI features in Excel, which help a lot, in various situations, and if you are familiar with these AI features in Excel, it would be of great advantage for you. So, in this tutorial, we are going to have a look at some AI features in MS Excel, about which, you should be familiar, so that you can try and implement them, in relevant situations.
AI Features in Excel
It’s time to explore some AI-related features in Excel, which you must know about so that you can make the most out of the software. The majority of the features that we are going to talk about are within Excel, you won’t need any plugins mostly, and within Excel only, you can easily find and apply those AI features.

Besides that, there is Microsoft Copilot, which makes use of Excel and many other office applications to a whole next level, but that’s a different universe on its own, so we are not going to get into that for now, but we will discuss some of the features, which are mostly built into Excel, that you can easily use.
So, first of all, here is a list of the AI features that we are going to discuss about –
- Pattern Recognition(Flash Fill)
- Insert data from Picture.
- Analyze Data
- Column from Example – Power Query
- Formula by Example(Excel Online)
- Forecasting
- Recommended charts
- Recommended PivotTables.
- Generating Excel Formula.
Now that we have listed all the AI features that we are going to discuss, let’s have a look at them one by one, and we will try to see some examples, to make the understanding more clear.
Pattern Recognition (Flash Fill)
Sometimes it happens with us, that we fill some data in Excel manually, which has some pattern. How about AI does the work for us? Well, in MS Excel, there is a feature called Flash Fill, which helps us kind of like that. You just need to fill in some data, and Excel recognizes the pattern, which can be applied then using Flash Fill.
For example, let’s say that we have some registration numbers of college students, which is a combination of their roll number, branch name, and year of admission. (For example – 2025CSE101 – here 2025 is the year of admission, CSE is the brand code, and 101 is the roll number. ). From this, we just need to extract the Year of Admission, Branch name, and roll number in separate columns, like this –
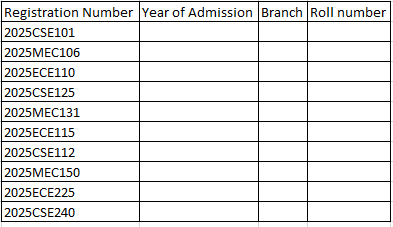
Well, someone might struggle for hours trying to get a formula to extract the required information. You can find some formula for doing this, but you don’t have to if you are just willing to paste some static information there. All you need to do is just give a couple of examples of the data that you want to extract, and Excel should understand the pattern, and then you would just hit Ctrl + E, which would implement the flash fill, and before you blink your eye, the data should be filled!
From the data in the above image, you can try to do the same. Just enter a couple of examples in the column, and hit Ctrl + E. But wait! Will you now start typing the data manually yourself? While you can, you don’t have to. This brings us to another AI feature in Excel, which helps us insert data from such images.
Inserting Data from Images
Just imagine, you get a table of data, but on some paper, and you need to now put it in an Excel sheet – how frustrating, right? Don’t worry, because Excel can help us now. The situation has come even for you to insert data from a picture. In the above section of flash fill, you have a picture, and you need to insert the data from that picture into your Excel sheet. You have got two options in this case –
- Either insert the data one by one(Hard work)
- Insert data using Picture in Excel(Smart Work)
The first one you can already do, and we are going to learn the second one now. So, download the above picture, by right-clicking on it, save it, and then follow the below steps, and you should be able to get the data into your Excel.
- Open the Excel workbook in which you want to insert the data.
- Go to the Data tab, and click on the option that says “From Picture”, in the Get and Transform data group.
- Then click on “Picture from File…”
- Then select the picture that you downloaded just before.
- As soon as you select the picture and click on Insert, you should see the “Data From Picture” pane on the right.
- First of all, click on review, since there might be some misunderstandings with the data. You can check them there by scrolling(the red cells show that it needs review)
- Click on review make some corrections, and then hit on insert, and there you go! The data is in Excel.
Well, you might say that hey… anyway we need to review and make corrections in data, so why not insert it manually? Well, the thing is that it depends on the quality of the picture that you provide, based on which, you are going to get the information in your Excel Sheet.
But anyway, reviewing and correcting seems better than writing the whole data from the image to an Excel sheet.
Analyze Data
Now we are going to discuss an amazing AI feature in Excel, called Analyze Data. In Excel, at times, we are dealing with literally thousands and thousands of rows of data(or even more than that), which makes no sense in one sight. Once you have that data, your boss throws a bunch of questions towards you, which you need to fetch from the data.
How about talking to Excel about your data in a natural language, and Excel will do the data analysis for you? Well, it’s not any science fiction, but a reality, which you can use today.
The option is called “Analyze Data” and is available on the Home tab itself. If it’s not there, please make sure that you are running the latest version.
Let’s say that we work for a company, which sells ice creams(well it’s just imaginary, but ice creams are my favorite). So, we have some data related to sales of our ice creams, and as usual, the boss asks a few questions related to the data, like which product was sold the most, which was sold the least, what was the total sales in March, or what was the total sales in March for some particular product, and a whole Excel full of questions!
Now you need to answer those questions, within half an hour, because you have a meeting then. So, no need to worry, because we have the Data, and “Analyze Data” with us.
Here is how you can access the “Analyze Data” option –
- Open your file which contains data.
- In the Home tab, you can find the “Analyze Data” option. If you don’t have it, maybe there is a version conflict, so you need to check the version of Excel you are using. If you are using Microsoft 365, you’re all set!
- Once you tap on the option, the Analyze Data pane should open, with some analysis already done on the data, and an input box for you to ask questions. Now, Data analysis would be done by Excel, and your job would be to ask the right questions.
So, when the pane opens, the data looks something like this –
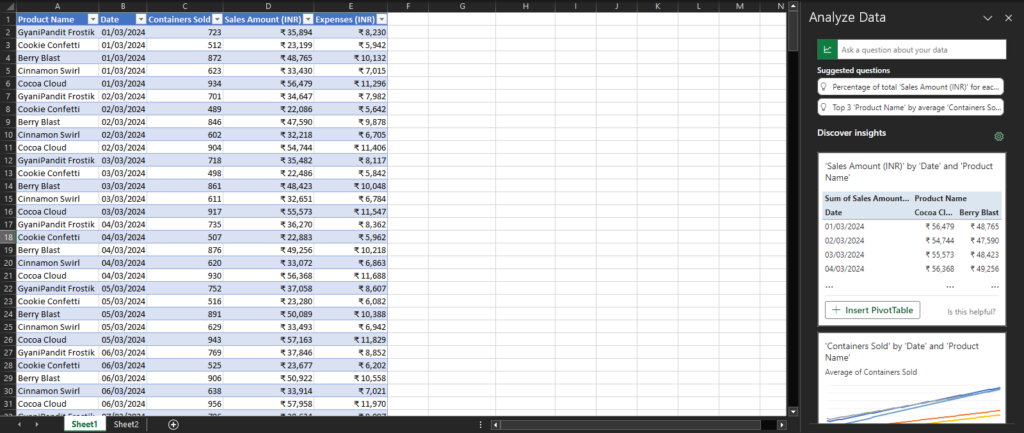
As you can see, there is some useful analysis done from the side of the Analyze Data option, and you can now ask some natural questions, like –
- How much Cocoa Cloud was sold in March?
- Which product sold the most in March?
- Which product sold the least in March?
- What was the total sales for each product?
So, with the Analyze Data option, data analysis is as simple as asking the right questions. So, this was another incredible option that comes built into Excel and helps us a lot.
Column from Example – Power Query
If you are a regular Microsoft Excel user, you might be already familiar with the Power Query, which is a super useful tool for data transformation. Through Power Query, you can import your data from multiple sources, clean it, and transform it for usage.
In Power Query, there is an incredible option, where we can create columns using a few examples. Let’s go with an example so that you can understand this option in a simple, and better way, and then you are free to explore more about it.
We are considering a disgustingly simple example for understanding power query, but you may take it further according to your use cases.
Consider that you have a file, in which there are columns like First name and Last name, but you want a column, that contains the full customer name, and let’s say you don’t know the formula for that. This is where Power query can help you. The data is no rocket science, just 2 columns, one for First name, and one for Last name.
Let’s get that data in the power query, so this is how you get the data –
- First, make sure your data is in some Excel file(or some other file, because we are bringing it through the power query)
- Open some Excel Workbook
- Go to Data Tab, and then click on “Get Data”, then hover on “From File”, and then Click on “From Excel Workbook”, because in our case, the data is in another Excel file.
- It would ask for the file now, obviously, so you just need to select the required file.
- After that, you get a window of Navigator, on which, you need to select Transform, and the Power Query Editor opens.
- Go to the Add column tab, and click on the “Column with Example” option.
- It brings up another column, where you can enter some data. Just add a couple of examples of how the data should be, and then the formula will be calculated, which would allow you for other data to be filled, and then the column is merged with the data.
As you can see, Power Query is a very useful tool when it comes to data transformation. You can explore more about Power Query, as there is a complete universe of this one tool, and we are just looking at its one feature.
Formula by Example(Excel Online)
Just imagine, you need to perform some task in MS Excel, but you are not sure about the formula, you don’t have to waste your hours and hours finding the right formula, maybe you can, but you don’t have to.
Excel has brought a feature, Formula by Example, where you would just enter examples in the column, and it would understand the pattern and come up with a formula related to it.
This feature is available in the Excel Online version, which is free to use. So, all you need to do is go to Excel Online, and then follow the below steps –
- First of all, convert the data to Table, if not already.
- Enter a couple of examples, while Excel finds the pattern, and provides a formula.
- When Excel presents a kind of popup window, with a formula, you can either apply it, otherwise if you think something is wrong, you can add more examples, and then apply the made formula.
Excel Formula by Example is available on Excel online, which is free to use for everyone, so even if you don’t have Excel software, you may try it online.
Forecasting
Excel is used a lot in the Finance sector, and there are some forecasting capabilities that Excel has. Forecasting helps with predicting stuff, like future sales, future prices, etc. Excel has some forecasting tools, which make this possible.
There is a feature called Forecast sheet, which helps us with forecasting our data, like the stock price, sales amount, profit, etc. Just we need to access the forecast sheet feature, which is available in the Data tab, in the Forecast Group.
Recommended charts
Charts are a great source of visualization, but only when we insert a correct chart, we can visualize things correctly. Sometimes we might feel confused about what chart should we apply to the data that we have. This is where Excel comes to the rescue again. While you are working on some data in Excel, Excel would recommend you with some charts, that you can use, or you can get the chart that you want by yourself, going through manual options.
For example, we have the data of different branches and the number of students placed in every branch, so it makes sense for Excel to recommend a Column chart, or if we have the data of our monthly expenses in various categories, you may get recommended with a Pie chart, because all the categories make up your whole expenses.
To access the recommended charts, you just need to follow the below steps –
- Make sure the right Excel workbook is open, and then click on the Insert tab.
- You can find the option which says “Recommended Charts”, where you will find some relevant and recommended charts for your data.
Recommended PivotTables
Just like we got the charts recommended, we can also get PivotTables recommended. At times, we might need to have some Pivot Tables in our Excel sheet, but if you are someone who is a beginner, or someone who is not sure what pivot tables should be included, then Excel can recommend you with some pivot tables.
To see the recommended PivotTables, you can just follow the below steps –
- First of all, convert your data into a table(it’s useful)
- Then go to the insert tab.
- On the insert tab, you can see the Recommended PivotTables option in the Tables group.
When you click on the Recommended PivotTables option, you get to see some pivot tables that you can use, and you can understand why some pivot table was recommended. It is a good option if you are just getting started with Pivot Table.
Generating Excel Formula
This feature is quite outside of Excel, but it is free for you to use anyway. Most probably you have heard the name of ChatGPT once in your lifetime. ChatGPT can help you get the right formula that you need for your operation.
But here, the key thing is that you would need to prompt it the right way, to get the right output, or otherwise, you would spend a frustrating number of hours, trying to generate a formula from ChatGPT, but nothing would work, and you would mistakenly think that ChatGPT can’t do that, but it’s dependent on the prompt that you insert.
So, here is a prompt that quite works well, and you can too make use of the below prompt, to Generate some formula for yourself.
Prompt:
Act as an advanced Excel Formula Generator, which can generate formulas for any given prompt from the user. Note that you are ONLY ALLOWED to give formula as output, and nothing else.
Example input and output:
Input Prompt: Calculate the total amount earned based on the number of products sold(cell F2) and their prices(cell D2)
Output: =F2 * D2
Input Prompt: Yes if the country is India, No otherwise. The country is in Column B and starts from B2.
Output: =IF(B2 = “India”, “Yes”, “No”)
Input Prompt: Calculate the square of the value present in cell D2
Output: = D2^2
Input Prompt: {Enter your prompt here}
Output:
In the last Input Prompt, you need to enter your prompt, like – “Write Yes if Payment = True, and No otherwise. The Payment column is the B column, and the data starts from B2”.
The more details you give in your prompt, the better output you will get. Here is an example of how ChatGPT acted in my case –
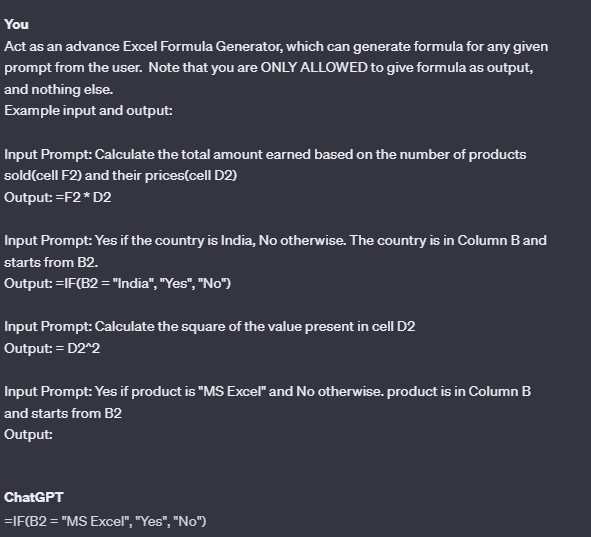
As you can see, we could get the formula, for whatever the required prompt was. If you ask the right question, you will get the right answer. With time, you might need to upgrade the prompt by making changes to it, but the above prompt works mostly(at least you can see in the image, we got the formula).
Conclusion
We talked about some features in AI features in MS Excel. Excel is a very widely used application, which is used in multiple industries, in multiple use cases. It’s so popular that every 1 in 8 people on Earth use Excel.
AI has been there for decades but has been gaining popularity recently, with newer use cases being introduced, and Excel is no exception, being so widely used. There are many AI-based features in Excel, which makes our work super easy. We discussed some features, mostly built – into Excel, and we could also see how can we get formulas for our task using AI. I hope that you found it useful.
FAQs
Q: What is AI in Excel?
Ans: Excel is a very widely used application, in many different industries, and there are many AI features in Excel, which can be used in various use cases, like Recommending Charts, pivot tables, Data Analysis, and more.
Q: Can AI be used in Excel?
Ans: Yes, there are many tools in Excel, which use AI, like Analyze Data option, Formula by Example option, and more.
Q: What is Excel with AI?
Ans: Excel has many AI-based features, which make our work a lot easier than ever. Most of the tasks that used to be done manually on Excel are now so simple with Excel.
Q: Can I use ChatGPT in Excel?
Ans: We won’t recommend using any Third-party plugins that you don’t trust, but there is Copilot, which you can use in Excel, and many other office applications, and that opens a whole new universe of opportunities in Excel. Also, you can take help from tools like ChatGPT, whenever you are stuck in Excel.